
In a recent post, Toxicology Education Foundation made some great comments about how toxicologists set a safe dose. I’d like to extend that teachable moment just a bit and comment about the importance of slope in toxicology; not the snow-covered mountain type, but the mathematical type.
In the dose-response world, as noted clearly in the illustrations in the TEF post, the response(s) typically increases in concert with dose until the response plateaus at some maximum, despite a higher dose. For responses measured at doses below the plateau, the response is proportional to dose, i.e. there is quantifiable increase in response for each increase in the dose. The ratio of the increased response per unit of dose can be calculated; that’s the slope of the line. It is also generally true that the measured responses at and around the 50% incidence are the most accurate (least variable), so the slope at the 50% incidence point is also the most accurate. There are mathematical reasons for this, but in basic terms it means that the variability in the measured response is smallest near the 50% incidence rate. This mathematical reality is useful because it can be used to compare responses or potency between or among chemicals. The term often used to make such a comparison is the ED50 or Effective Dose 50%. The ED50 is the dose of a (chemical or other) substance that produces an effect (a response) in 50% of the individuals exposed to that dose.
As an example, consider a comparison of two substances that each produce an odor [substances P and Q in FIGURE 1]. We all realize that different individuals differ in their ability to smell something. So which substance has the more intense or stronger smell? If you permit one group of individuals to sniff different concentrations of both substances then determine the concentration at which 50% of the test subjects could detect each of the two odors, you have determined the ED50 for each substance. The substance with the lower ED50 is the stronger smelling substance; substance “P” in this case.
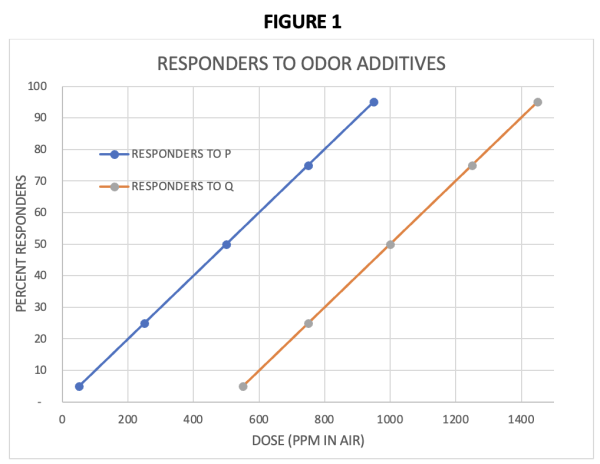
A more traditional use of the same type of response testing would be to allow different groups of individuals to sniff different concentrations of only one substance. Then determine the ED50 from the results for each group. If the individuals who make up each sniffing group are similar, e.g. identical twins who are third grade students in Ohio, then the substance with the lower ED50 is the stronger smelling substance. Ah, but what if there are differences between the groups, e.g. fraternal twins or students not related to each other, or twins in Delaware? Good questions! More on that in a later post.
So where does the concept of slope come into play?
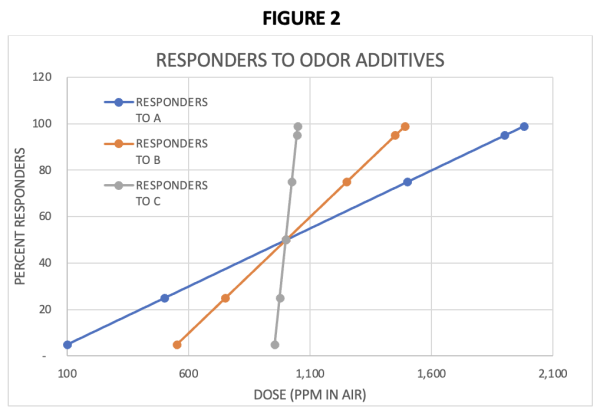
Imagine, similar to the example above, three different substances [A, B, & C in FIGURE 2] with the same ED50 for smell detection in test groups of 1000 individuals. The data points in this example were specifically chosen to illustrate the concept; they are not real datasets. For substance “A” there is a 5% increase in the number of responders for each unit of increase in concentration of substance “A”; the slope is 0.05/1 = 0.05. For substance “B” there is a 10% increase in the number of responders for each unit of increase in concentration of substance “B”; the slope is 0.10/1 = 0.10. For substance “C” there is a 100% increase in the number of responders for each unit of increase in concentration of substance “C”; the slope is 1.0/1 = 1.0. At the ED50 point, the graph tells us that the three substances are equally smelly, but there are different slopes for substances A, B, & C. They are 0.05, 0.10, and 1.0, respectively. How do you use this as a toxicologist?
Well, let’s say you are the toxicologist asked to determine which of these substances would be best to use as the odor producing additive in storage tanks of an odorless, but flammable, gas that we’ll call gas “G”. For this gas you would want to be quite sure almost anyone (more than 95% of individuals) would be able to smell the additive at a concentration of “G” significantly below the concentration at which it explodes. We’ll call the explosion concentration “X”. So, you want gas “G”, with an additive in it, to be smellable at a concentration well below concentration “X” to allow gas users time to take corrective action to prevent explosions in case of any leaks. You and the gas “G” producer decide that a concentration of X/100 will allow sufficient time to take corrective action.
Toxicologically, would you recommend to your client, the producer of gas “G”, that they could use any of the additives because A, B, and C have the same ED50 for odor detection, or would you consider recommending a specific odor additive? You and the producer quickly recognize that a 50% response for odor detection is not sufficient to protect the workers or the facility. If half of the workers could not smell the additive, a dangerous situation could develop, so you decide to consider the 95% and 99% response concentrations for each substance.
You know the slope of the dose response for each substance (the increase in responders per unit of each substance) so you can determine by extrapolation what concentration will likely be detectable by 95% or 99% of the users (these points are plotted in the graph for each substance). You’re also aware that the accuracy of the smell detection data is optimal around the ED50 and variability increases (accuracy decreases) as you move up (or down) the dose-response curve from the ED50 point.
Since you know that at the 95% or 99% response points the odor detection result is variable, to account for this uncertainty in the response and be sure the users are safe, you would likely recommend that the producer augment the calculated 95% or 99% response concentration of the additive present at the X/100 concentration of “G”. How much augmentation?
What additive do you recommend the producer use in this case? Would you recommend the odor additive for “G” be the substance with the low slope [“A”], the high slope [“C”], or the intermediate slope [“B”]?
Let’s look at the low slope option of 0.05? If this is your recommendation, you would tell the producer they need to add sufficient concentration of “A” to gas “G” so that, at the X/100 concentration of “G”, there are approximately 2,000 PPM of “A” [the 99% response level]. However, you know that at the 99% response point the result is variable, so to be sure the users are safe you would likely recommend that more than 2,000 PPM of “A” be present at the X/100 concentration of “G”. For this “safety factor”, how much more? Twice as much (4,000 PPM), 10 times (20,000 PPM), 100 times (200,000 PPM)? Wow, that’s a lot of additive “A” in the gas. This is expensive, and maybe not technically feasible! With a slope of 0.05, or 5 additional responders per 100 PPM of dose, any addition on the 99% response as a “safety factor” would need to be large to approximate 100% of responders. Is there another option?
Yes, you could recommend the substance with the high slope of 1.0. In this case, you would recommend your client add enough substance “C” to gas “G” so that, at the X/100 concentration of “G”, approximately 1,000 PPM of “C” are present (half as much as “A” for 99% response). Just as with substance A, you know that at the 99% response point the result is variable, so to be sure the users are safe you would likely recommend more of “C” as a “safety factor”. How much more? With a slope of 1.0, or 100 additional responders per 100 PPM of dose, any addition on the 99% response as a “safety factor” could be much smaller with “C” than with “A” to approximate 100% of responders.
Wow, slope tells you that among the three equally smelly substances [ED50 of “A”, “B” and “C” are all 1,000 PPM], significantly less additive “C” in gas “G” will get the same level of worker protection and safety for the storage facility of gas “G”. You recommend additive “C” because you know how to use the value of slope in dose-response.
The bottom line is this: Slope is a critical factor in evaluating toxicological dose-responses. Slope helps evaluate the potential impact on response to variations around a particular dose level one has an interest in evaluating. Finally, slope can help to establish appropriate Uncertainty Factors [UF] to account for the response variation at any given dose level or exposure.